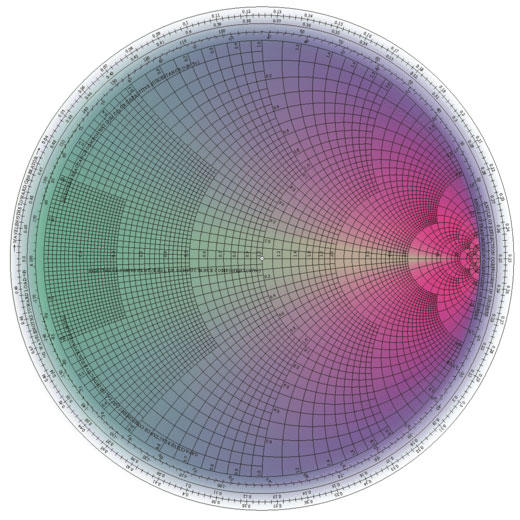
Before the days of calculators and computers, Nomograms (or Nomographs) were often used to approximately calculate values of a function. There are specific nomographs for specific applications and all of them will only give approximate answers (since accuracy is dependent on the precision of the drawing itself). Invented by French mathematicians Massau and M. P. Ocagne in 1889, the precision, geometry and symmetry involved in the graphics of Nomography can produce some beautiful ‘visualizations’ like the Smith Chart above.